Conversations and insights
Read your overview
Overview is the first page of every knowledge base. It answers one question: are customers getting answers from your docs?
The numbers
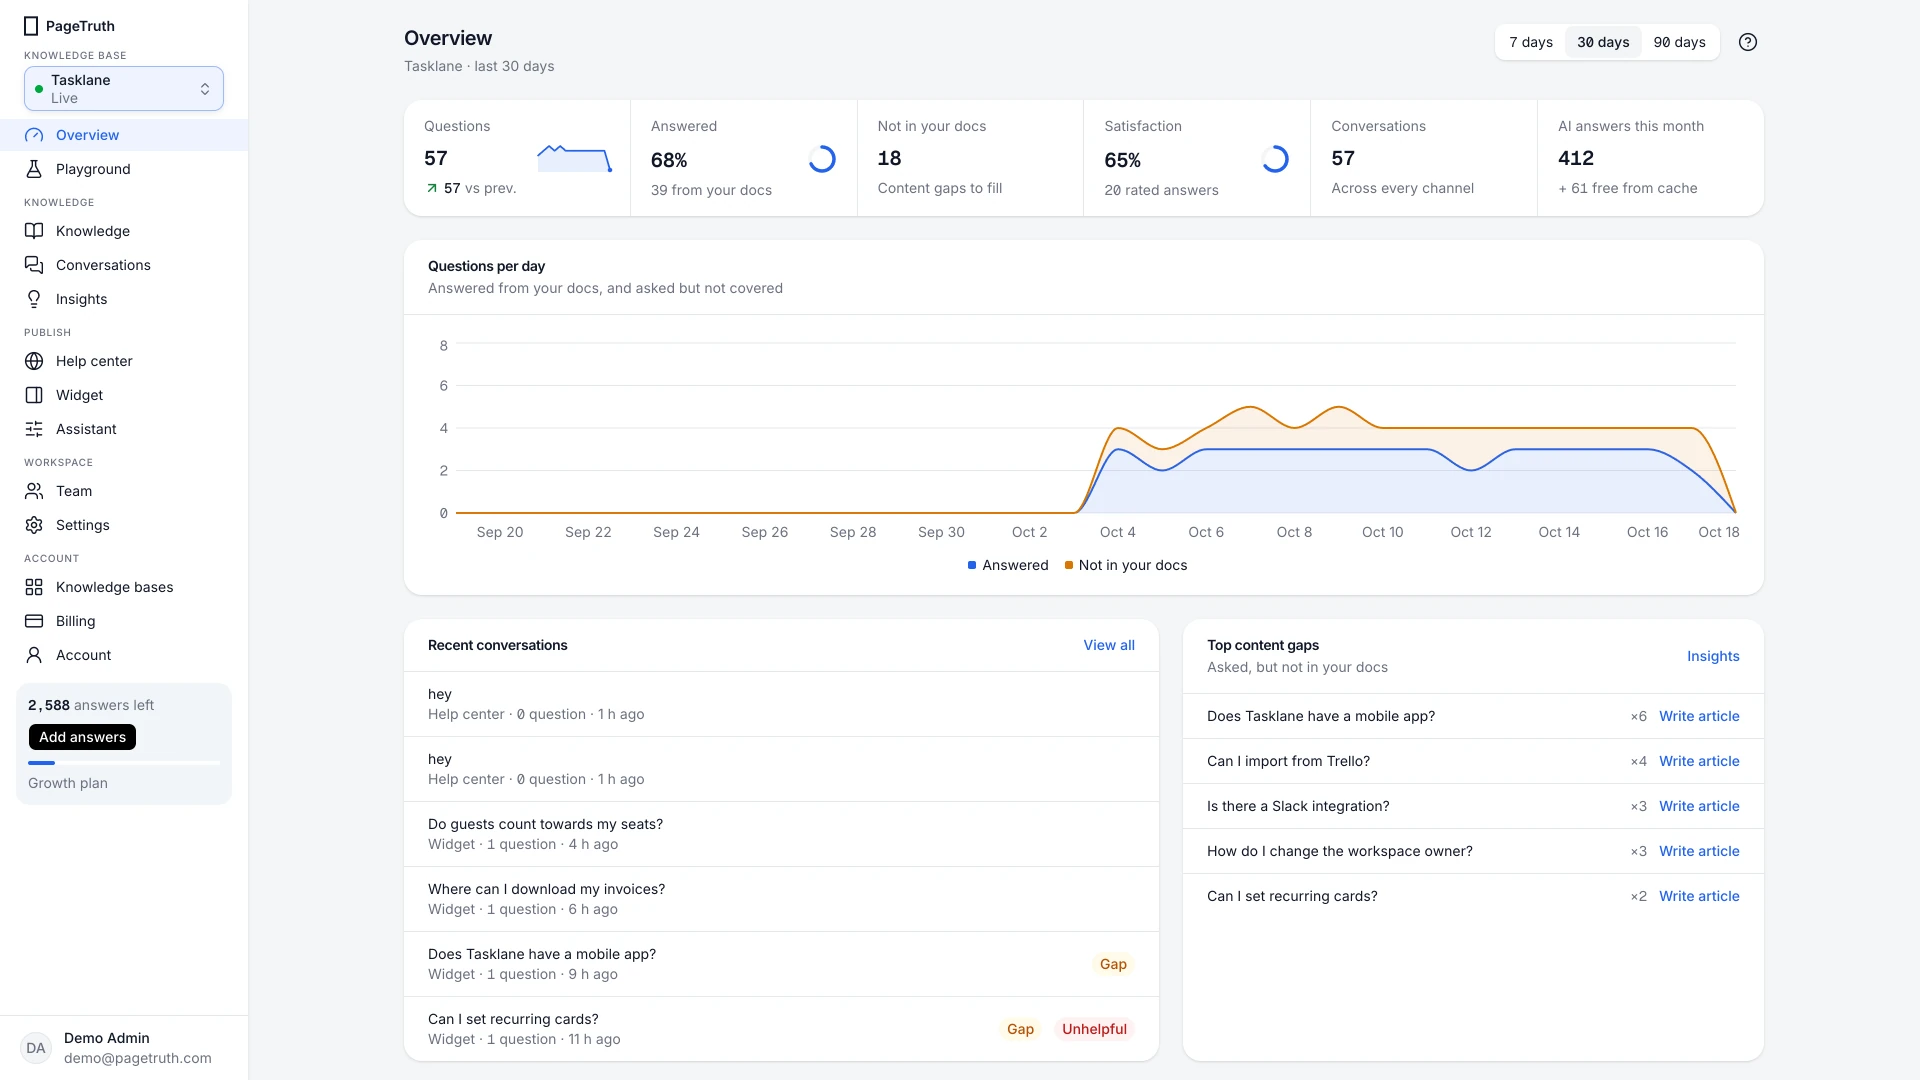
| Tile | What it counts |
|---|---|
| Questions | Questions customers asked in the period, on every channel, with the change from the period before |
| Answered | The share answered from your docs |
| Not in your docs | Questions your docs couldn't answer: your content gaps |
| Satisfaction | The share of rated answers rated helpful |
| Conversations | Separate conversations across the help center, widget and API |
| AI answers this month | Answers this knowledge base used from your plan, and how many were free from cache |
The period
Choose 7 days, 30 days or 90 days at the top right. How far back you can look depends on your plan: 7 days on Free, 30 on Starter, 90 on Growth and a year on Scale.
The chart and the lists
Questions per day splits each day into answered and not covered, so you can see whether a release or a new article changed things.
Recent conversations shows the latest questions; Top content gaps lists what customers keep asking that your docs don't cover, with a Write article shortcut.
What good looks like
A healthy knowledge base answers most questions from its docs. When Not in your docs rises, open Insights and write the missing answers, starting with the most asked.
Was this helpful?